
Reading an explanation
What the numbers in an explanation mean, how to read them in a review, and what they do not tell you. Written for risk, compliance and audit teams.
#In short
- An explanation is about one decision. It lists the inputs that moved this prediction away from the model's average, and by how much.
- The pushes add up. Start from the average, add every push, and you arrive at this prediction.
- It describes the model, not the world. It shows how the model reached its output. On its own it does not show that the decision was fair, lawful or correct.
#An example, step by step
A credit model scores loan applications for the chance that the application should be declined. Here is its explanation for one applicant, as the dashboard and the API report it.
Together the pushes add 10.4 points, taking the average of 49.0% to this applicant's 59.5%. Figures are rounded.
- The prediction. The model gives this applicant a 59.5% chance of decline. That is above the 50% threshold, so the decision is decline. Every explanation names the outcome it explains, here decline, and every push is toward that outcome or away from it.
- The starting point. 49.0% is the model's average prediction over the reference applicants: the population your team chose to compare against, usually recent applications or the validation data. Every explanation answers the question "compared with whom?". Change the population and the numbers change, which is why Kaimei records it with every explanation.
- The pushes. Each bar is one input. A debt-to-income ratio of 0.38 raised the chance of decline by 8.0 percentage points. One recent delinquency added 7.5. Utilisation of 41% lowered it by 6.2. Debt-to-income accounts for about a fifth of all the movement, which the API reports as its share.
- What would change the decision. Kaimei searched for the smallest change that flips the decision while keeping age fixed. Raising the credit score to 850 would do it. This is a property of the model, not advice to the applicant: the change it finds may be unrealistic, and you decide which inputs it may not touch.
#Reading the pushes
- Check the direction first. A positive push moves the prediction toward the explained outcome. For a model that scores decline, a positive push is bad news for the applicant; for a model that scores approval it would be good news.
- Read the size in the output's own terms. For a yes/no or multi-class model the unit is percentage points of the predicted chance. For a numeric prediction it is the prediction's unit: the grid demand model starts from an average of 3,215 MW, and for one hour an industrial index of 1.08 lowers its forecast by 397 MW while 31.5 °C raises it by 232 MW.
- A small push does not mean an unimportant input. It means this applicant's value was close to typical. The credit score pushed only 2.1 points here, yet changing it is what flips the decision. To see what the model relies on across everyone, read its global importance.
- Related inputs share credit. When two inputs carry the same information, such as income and debt-to-income, the credit can be split between them in ways that look arbitrary. Read related inputs together.
- Check the values. Every push is shown with the input's value, so you can confirm the explanation describes the case you are reviewing.
#Why two explanations of the same case can differ
Three things change the numbers, and Kaimei records all three with every explanation.
- The method. KernelSHAP is exact for models with up to 12 inputs and gives the same answer every time. Permutation sampling estimates the same quantity and reports a margin of error for each push. LIME fits a simple local approximation and reports how well it fits. Strong drivers agree in direction and order; small pushes can differ.
- The reference population. A different starting point gives different pushes.
- The model version. A retrained model is a new version with its own explanations.
Recommended For decisions you may have to justify later, explain with KernelSHAP and a fixed seed, and keep the decision id, model version and reference population with the record. See explanation methods.
#Explanations of images
For an image model the pushes belong to regions of the picture rather than to named inputs.
- The heatmap. Amber to red marks evidence for the explained class; light blue to indigo marks evidence against it.
- The focus. A white outline marks the smallest region that holds half of the evidence.
- The evidence check. Kaimei reports the chance of the class for the whole picture, with the focus hidden, and with only the focus shown. If hiding the focus barely changes the answer, the model is relying on the rest of the picture.
- The summary. One sentence states where the model looked and how much that region alone decides.
The model looks mostly at the centre of the photo: half of its evidence for dog sits in 12% of the picture. That region alone is enough to say dog (P(dog) = 99.7%); with it hidden, P(dog) falls from 90.4% to 5.0%.#What an explanation does not tell you
- It is not causation. It shows how the model's output responds to its inputs, not that changing an input in the real world would change the real outcome.
- It is not a fairness test. A protected characteristic can influence decisions through other inputs that correlate with it, without appearing in the list. Kaimei does not compute fairness or disparate-impact metrics.
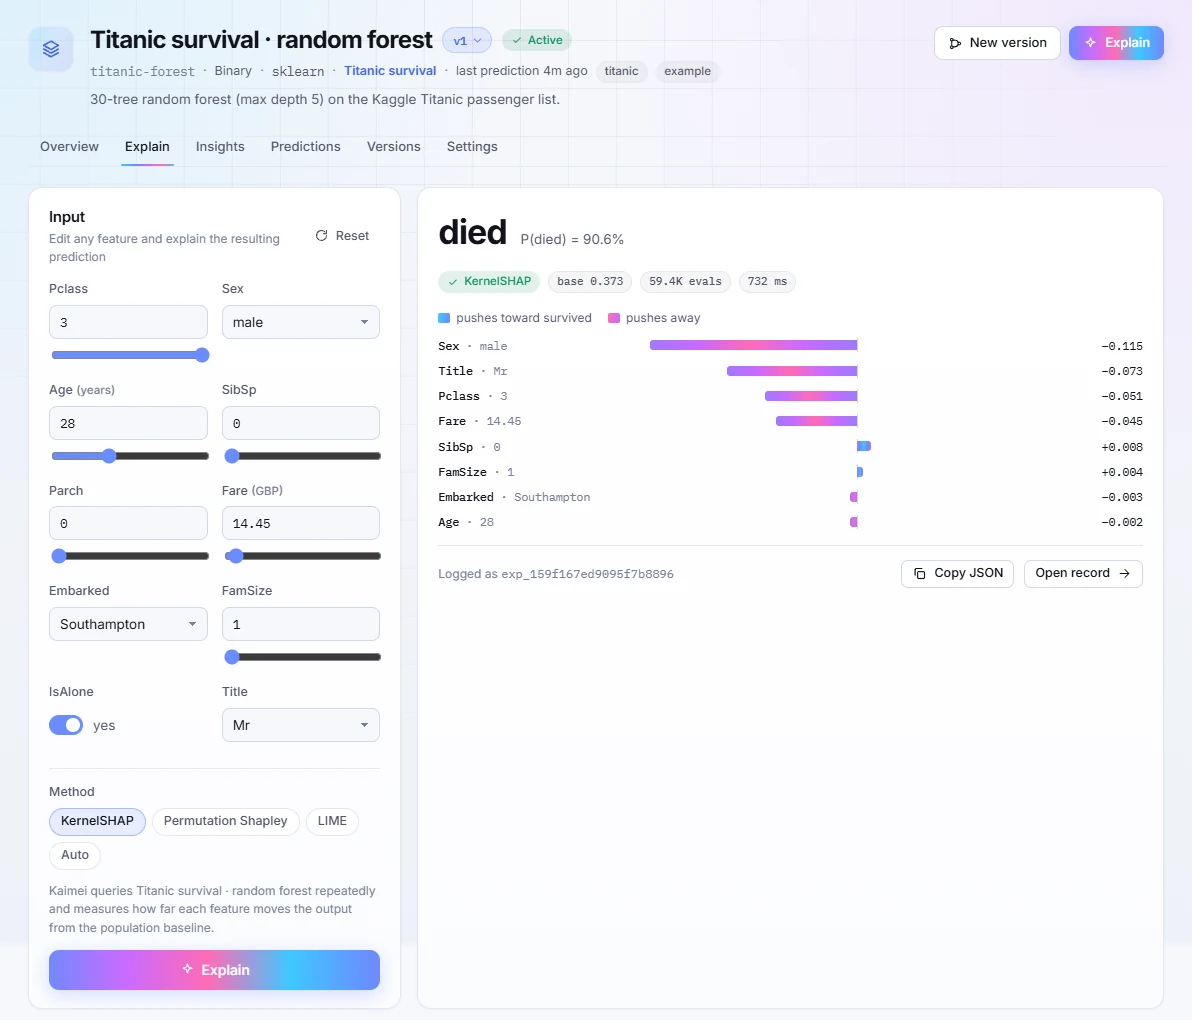
- It does not check the data. If an input is wrong, the explanation faithfully explains the wrong input. The monitoring notebook shows a fare sent in pence instead of pounds becoming the biggest push.
- It does not see your policy. Rules applied outside the model, such as cut-offs, overlays and manual decisions, are invisible to Kaimei.
#Questions to ask in a review
- Which outcome is explained, and what threshold turns the score into a decision?
- Which population is the starting point, and is it the right comparison for this decision?
- Are the largest pushes inputs the model should be using? Are any of them protected characteristics, or likely proxies for one?
- Do the values shown match the case under review?
- Does the explanation agree with the model's overall behaviour in its insights?
- Has the model drifted since it was validated?
- Was the explanation stored with the decision id, the model version and the method?